„Radonas“- vienintelė įmonė lietuvoje, kuri specializuojasi radiatorių taisymo srityje nuo 1991 m.
„Radonas“ remontuoja visų tipų aliumininius, varinius, žalvarinius, plieninius ir iš kitokių medžiagų pagamintus radiatorius.
„Radonas“ diagnozuoja ir remontuoja variklio aušinimo, suspausto oro aušinimo (interkulerio), kondicionieriaus sistemos , tepalo aušinimo, salono šildymo (pečiuko), oro srauto šildymo (kaloriferio) radiatorius.
„Radonas taiso mopedų, motociklų, lengvųjų automobilių, autobusų, sunkvežimių, vilkikų, traktorių, kombainų, šilumvežių ir kitų agregatų radijatorius.
„Radonas“ suvirins įvairių rūšių plastmasines radiatorių detales, suvirins aliumininius, žalvarinius, plieninius radiatorius.
„Radonas“ išplaus pečiuką jo neišmontavę
„Radonas“ atkimš karbonatinėm apnašom užsikimšusius (užkalkėjusius) radiatorius, atkimš tepalu ar tepalo emulsija užkimštus radiatorius ir visą aušinimo sistemą ir išplaus visą aušinimo sistemą , kai ji užteršta mechaninėmis priemaišomis (kimšikliais).
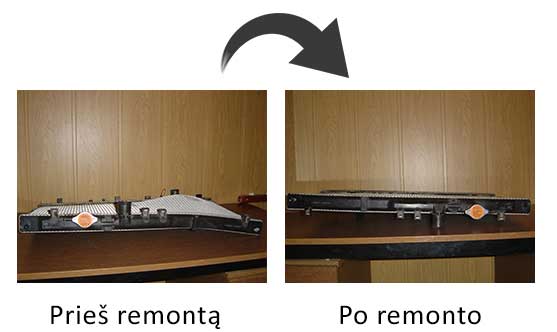
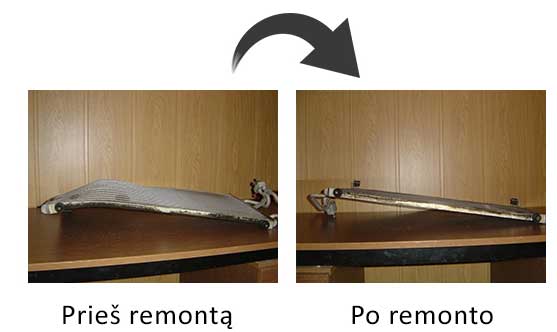
„Radonas“ išlygins deformuotą radiatorių (žiūr. nuotraukas)
„Radonas“ suteiks 6 mėn. garantiją atliktiems darbams.
Paslaugos
Radiatorių remontas
Visų rūšių automobilių, motociklų, sunkvežimių, traktorių ir kitos technikos radiatorių taisymas. Užsikimšusių radiatorių atkimšimas, aušinimo sistemų valymas. Remonutojame radiatorius pagamintus iš aliumininio, vario, žalvario, plieno. Restauruojame įvairių tipų radiatorius.
Prekyba aušinimo sistemų dalimis
Parduodame aušinimo sistemų radiatorius sunkiajai technikai - traktoriams, sunkvežimiams, autobusams, šakiniams keltuvams. Oro, skysčio, tepalo bei kondicionierių aušinimo radiatorius.
Aušinimo radiatorių šerdžių keitimas
Keičiame įvairių tipų radiatorių šerdis (vandens, oro, tepalo aušinimo), atliekame jų remontą, patikrą.
Kontaktų forma
Kontaktai
- Chemijos g. 23, Kaunas LT-51332
- JUSTAS - +370 688 77855,
NERIJUS - +370 605 99597
- justas@radonas.lt

E-komercijos sprendimų diegimas efektyvesniam verslo procesų valdymui
Nr. 13.1.1-LVPA-K-860-01-0862
| Programa | 13 PRIORITETAS. Veiksmų, skirtų COVID-19 krizei įveikti, skatinimas ir pasirengimas ekonomikos atgaivinimui |
| Projektą finansuoja | Europos regioninės plėtros fondas |
| Projekto vykdytojas | UAB Radonas |
| Projekto tikslas/planuojami rezultatai | Radonas - vienintelė įmonė Lietuvoje, kuri specializuojasi radiatorių taisymo srityje nuo 1991 m. Reaguojant į COVID-19 pandemiją ir planuojant įmonės plėtrą buvo apsispręsta inicijuoti skaitmeninę įmonės transformaciją, išvystyti e-parduotuvę ir įdiegti integracijas su turimais e-sprendimais. |
| Projekto vertė | 60 800 EUR |